Screenshots from internal Seattle City Light application presenting results of spatial analysis of historical outage data, focusing on tree/weather and equipment failure outages.
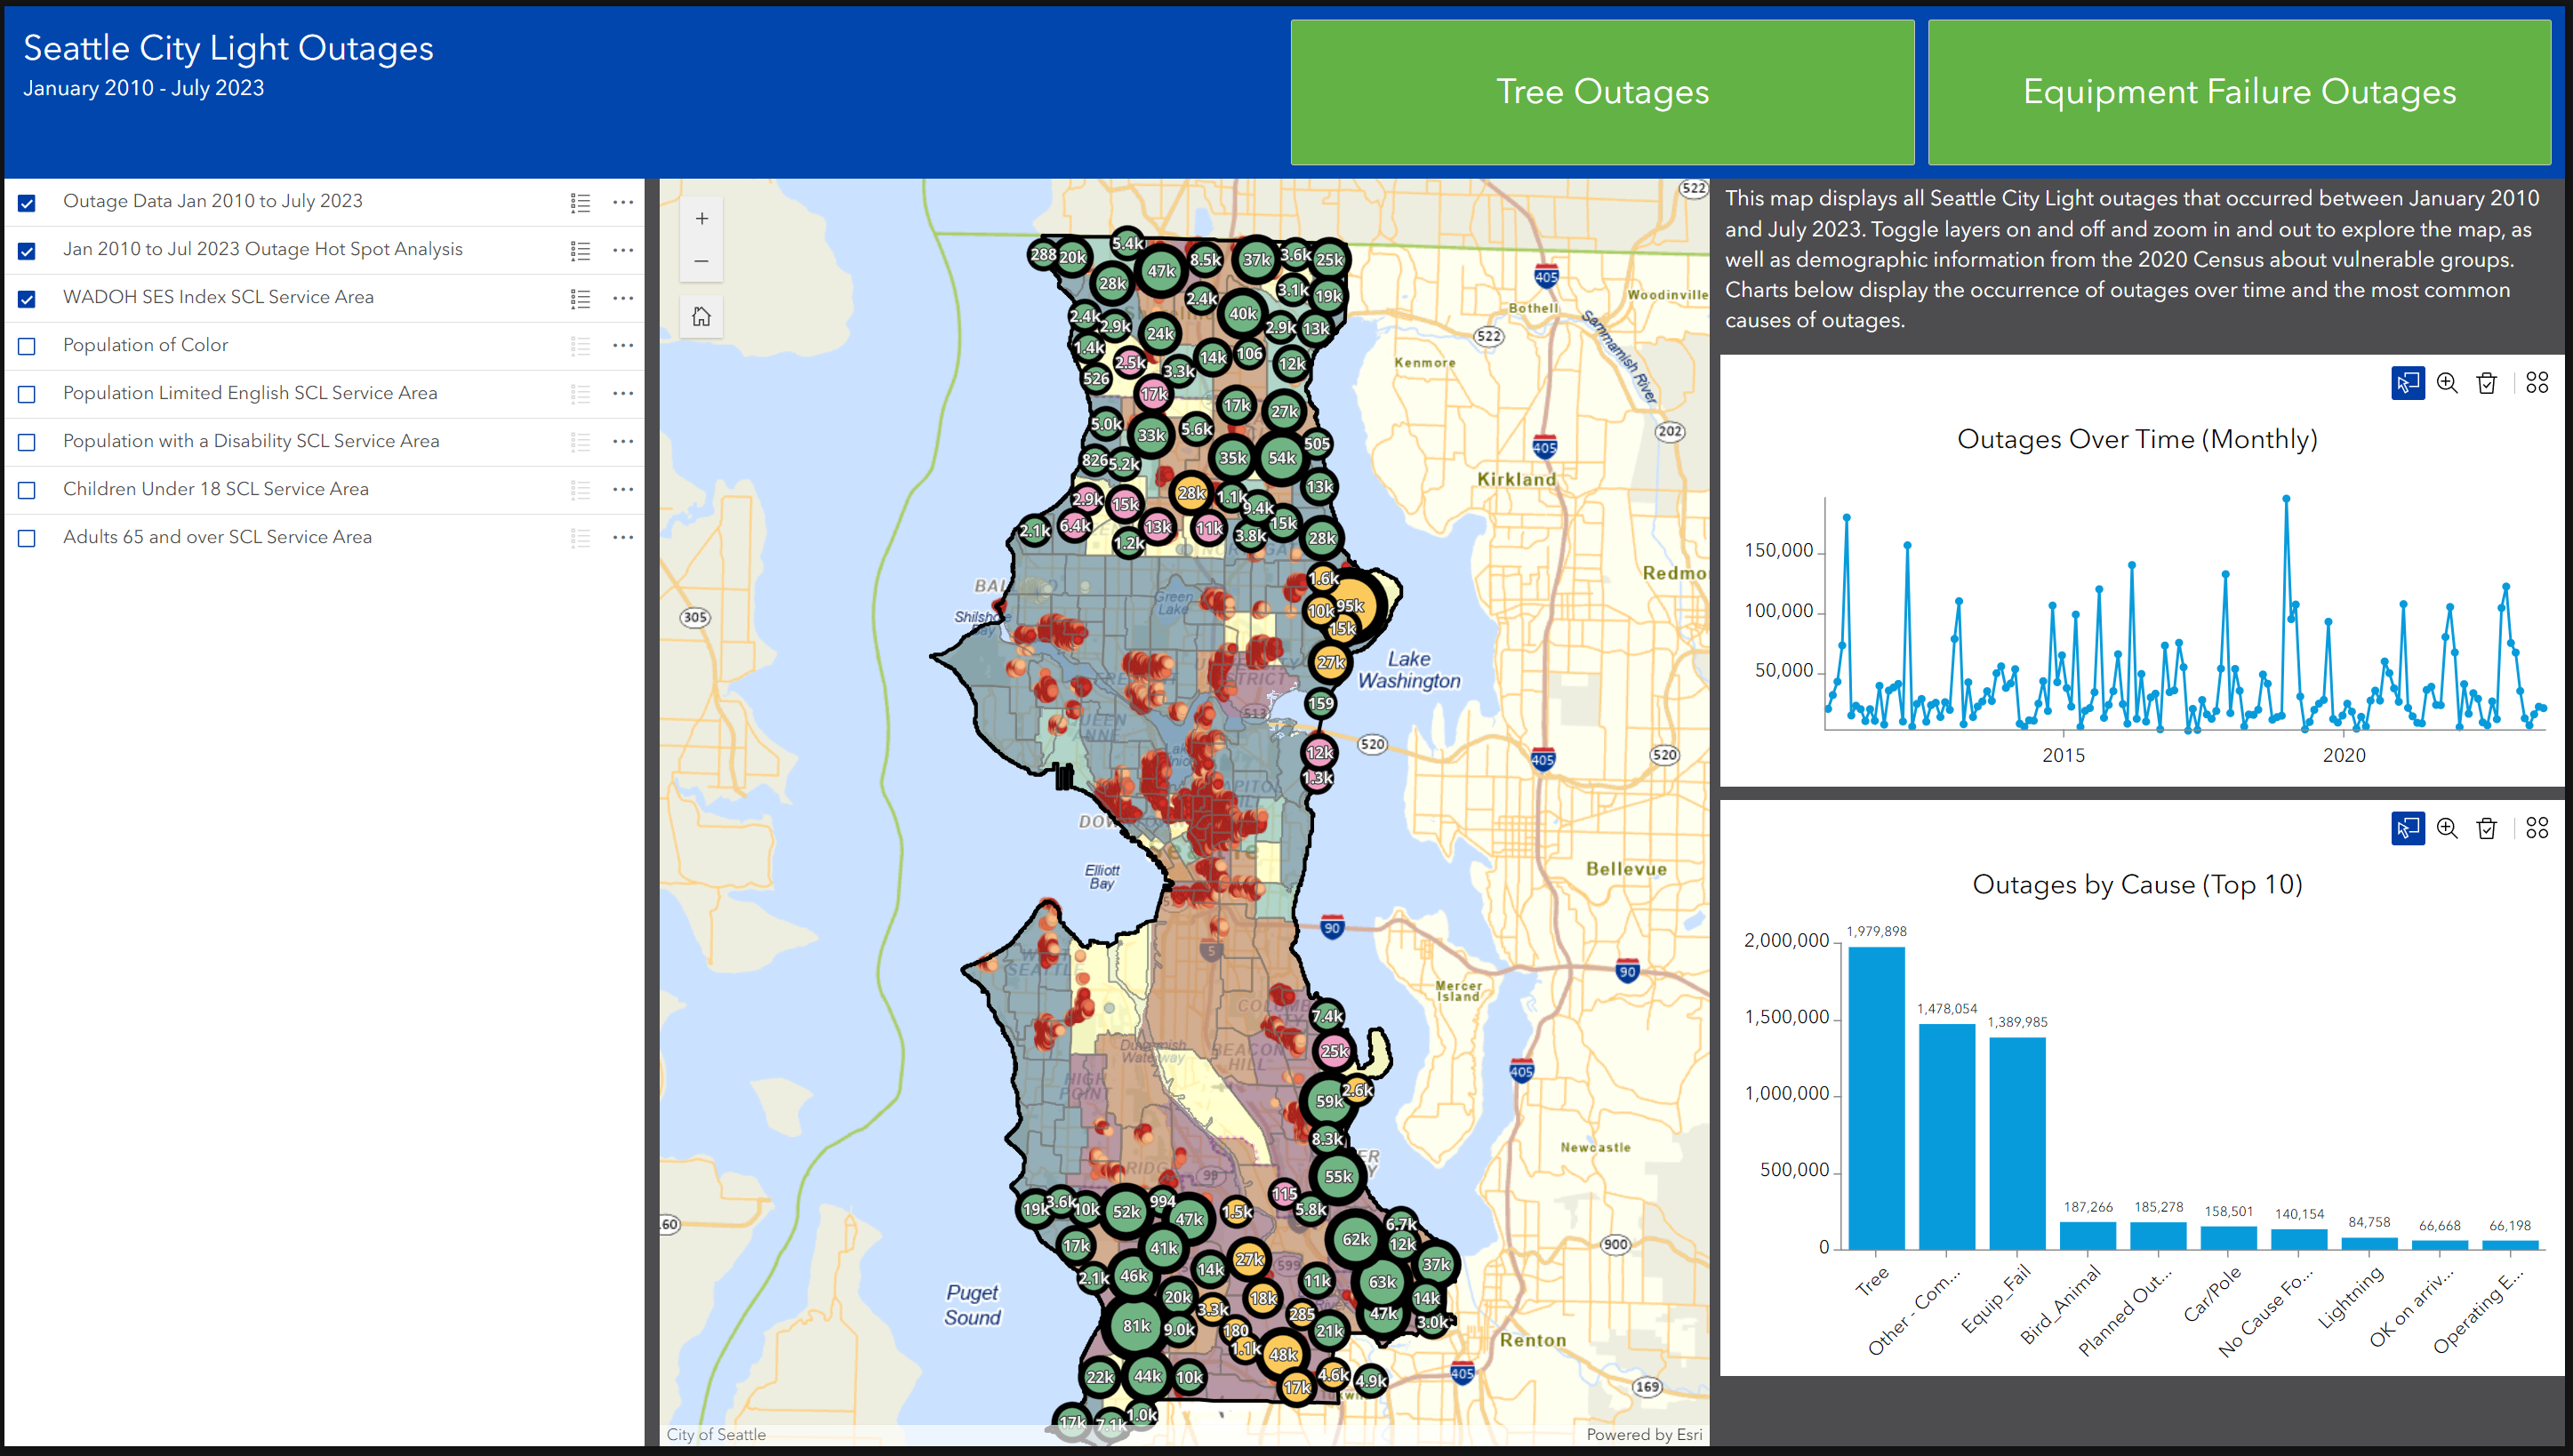
All Outage Data Analysis
Experience Builder page screenshot with all outage data with aggregation, hot spot analysis and Washington Department of Health Socioeconomic Status Index. Chloropleth maps of other vulnerable groups are also available. A line graph shows all outages over time, and the top 10 causes of outages.
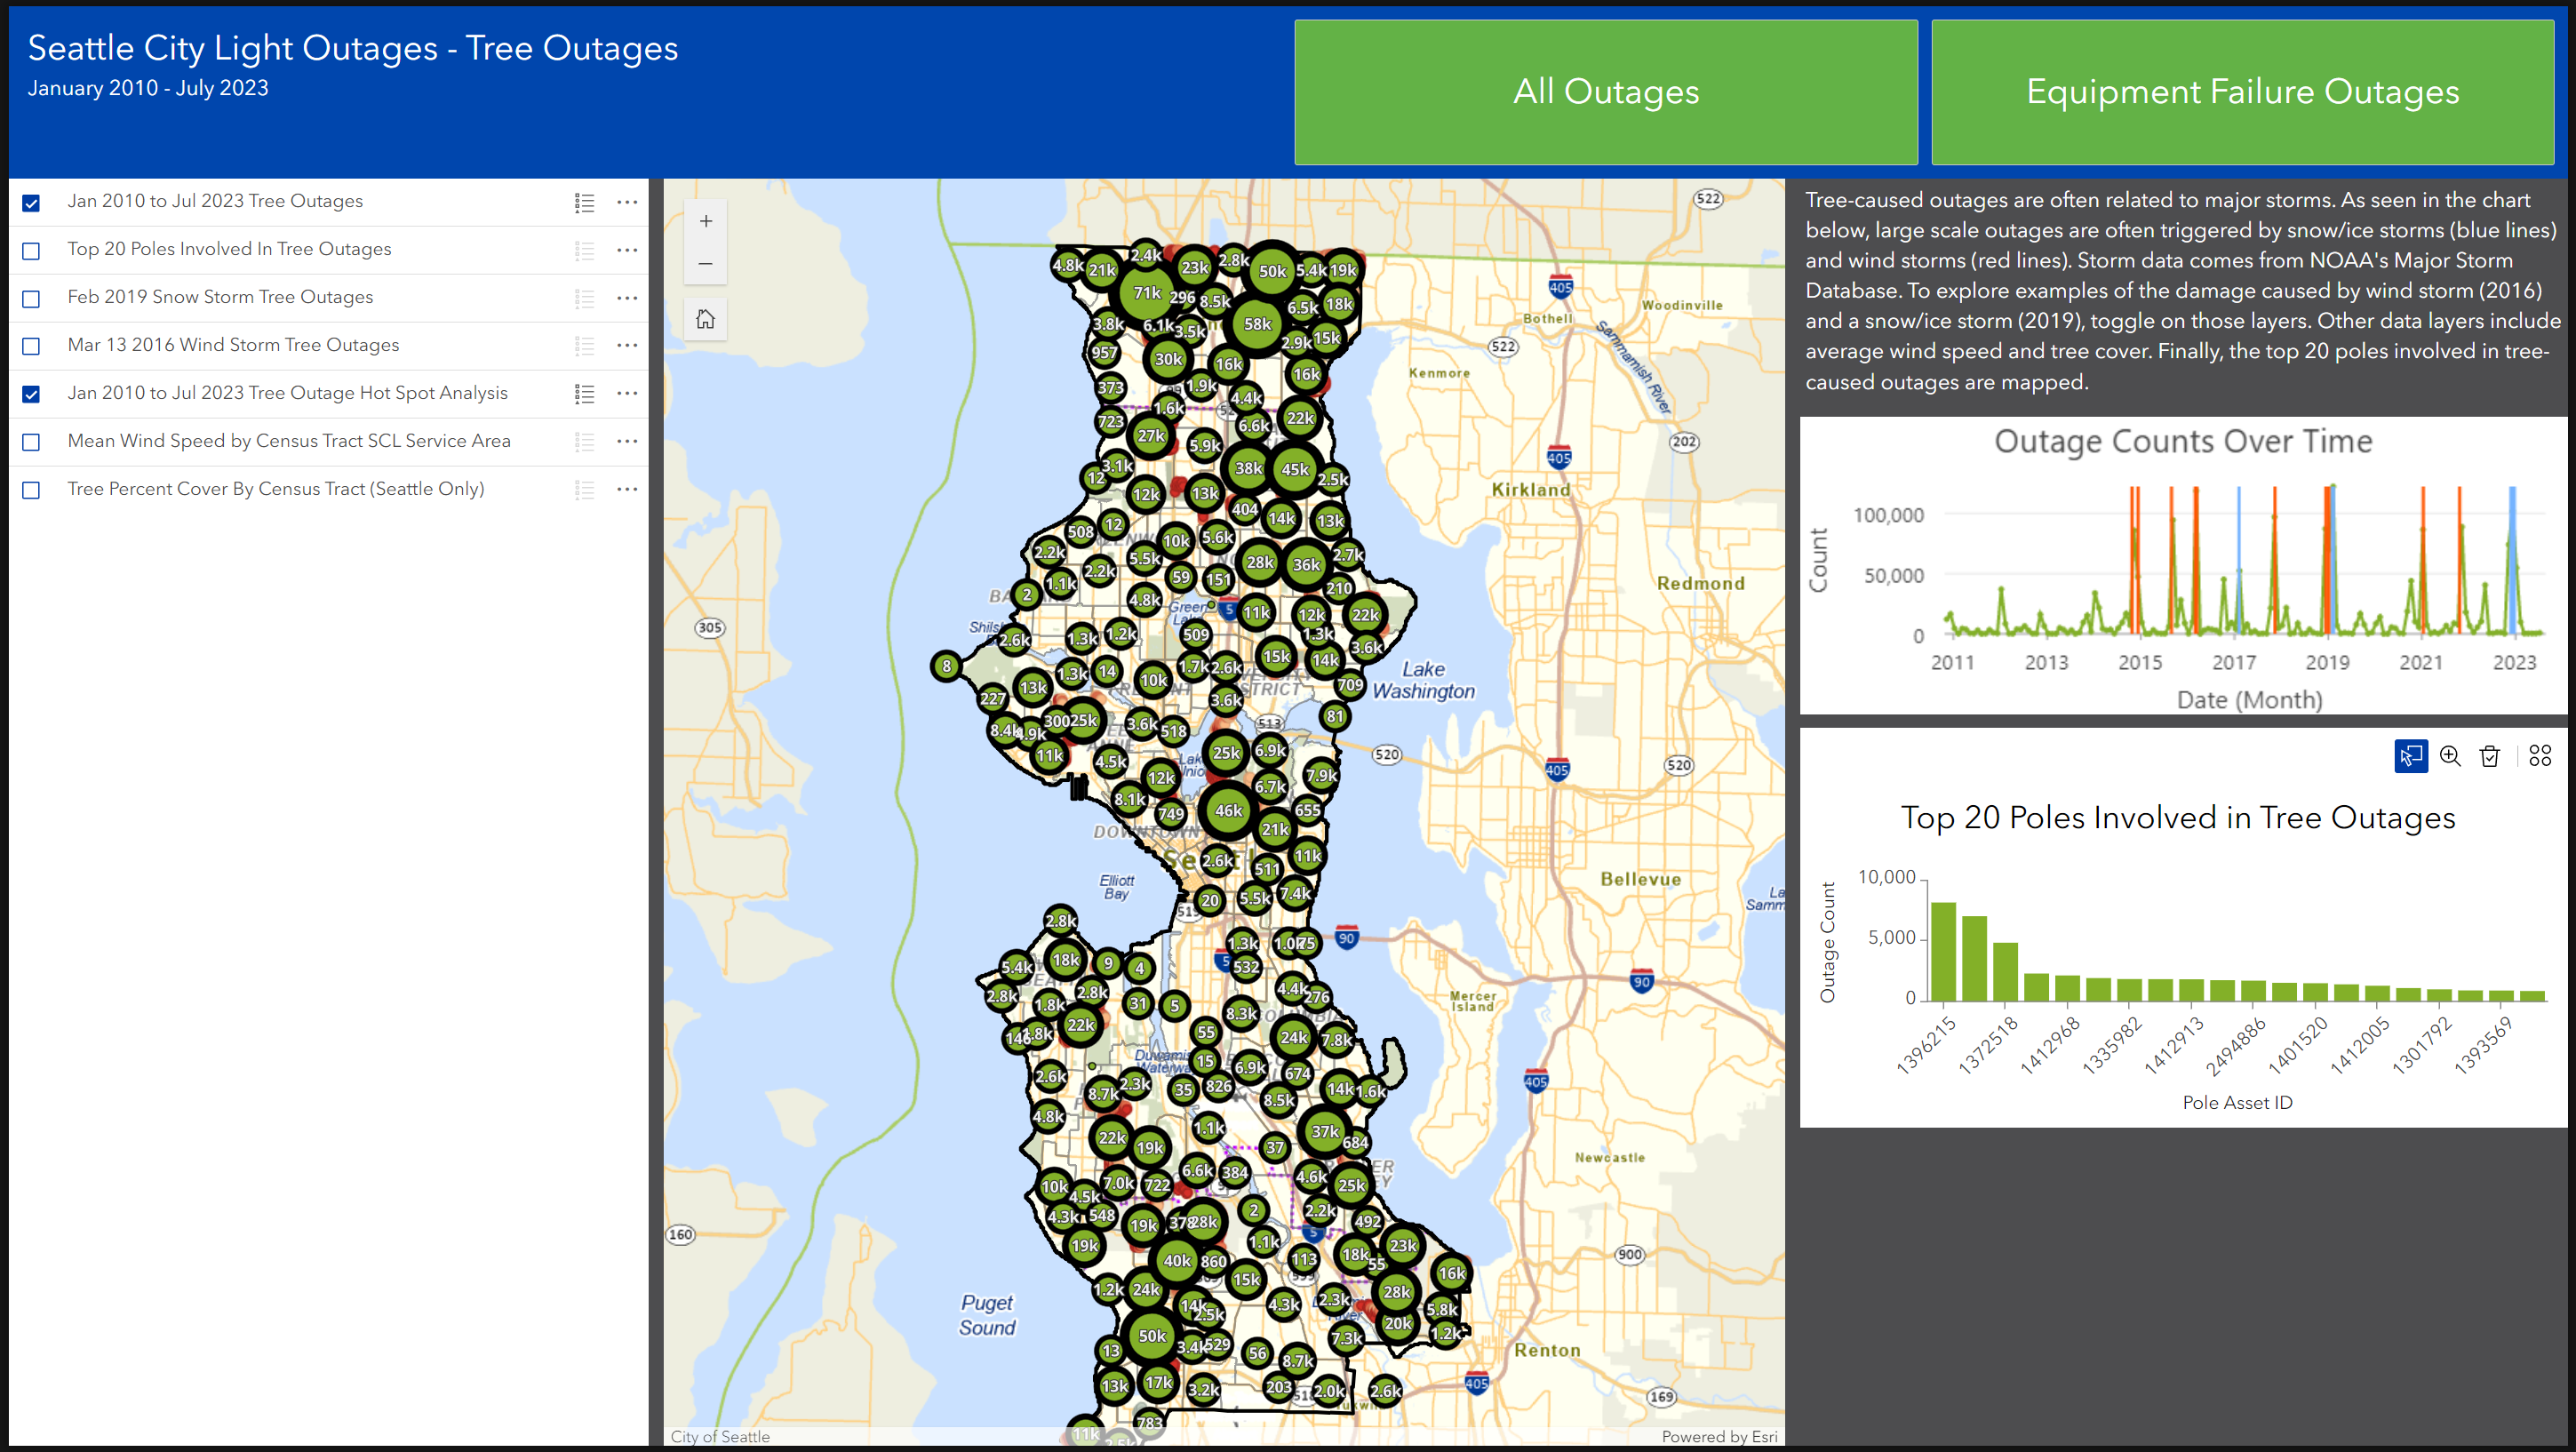
Tree Outage Data Analysis
Experience Builder page screenshot with tree outage data with aggregation and hot spot analysis. A line graph shows tree outages over time and major wind and ice/snow events derived from NOAA data. A bar chart shows the ids of the top 20 poles involved in tree outages.
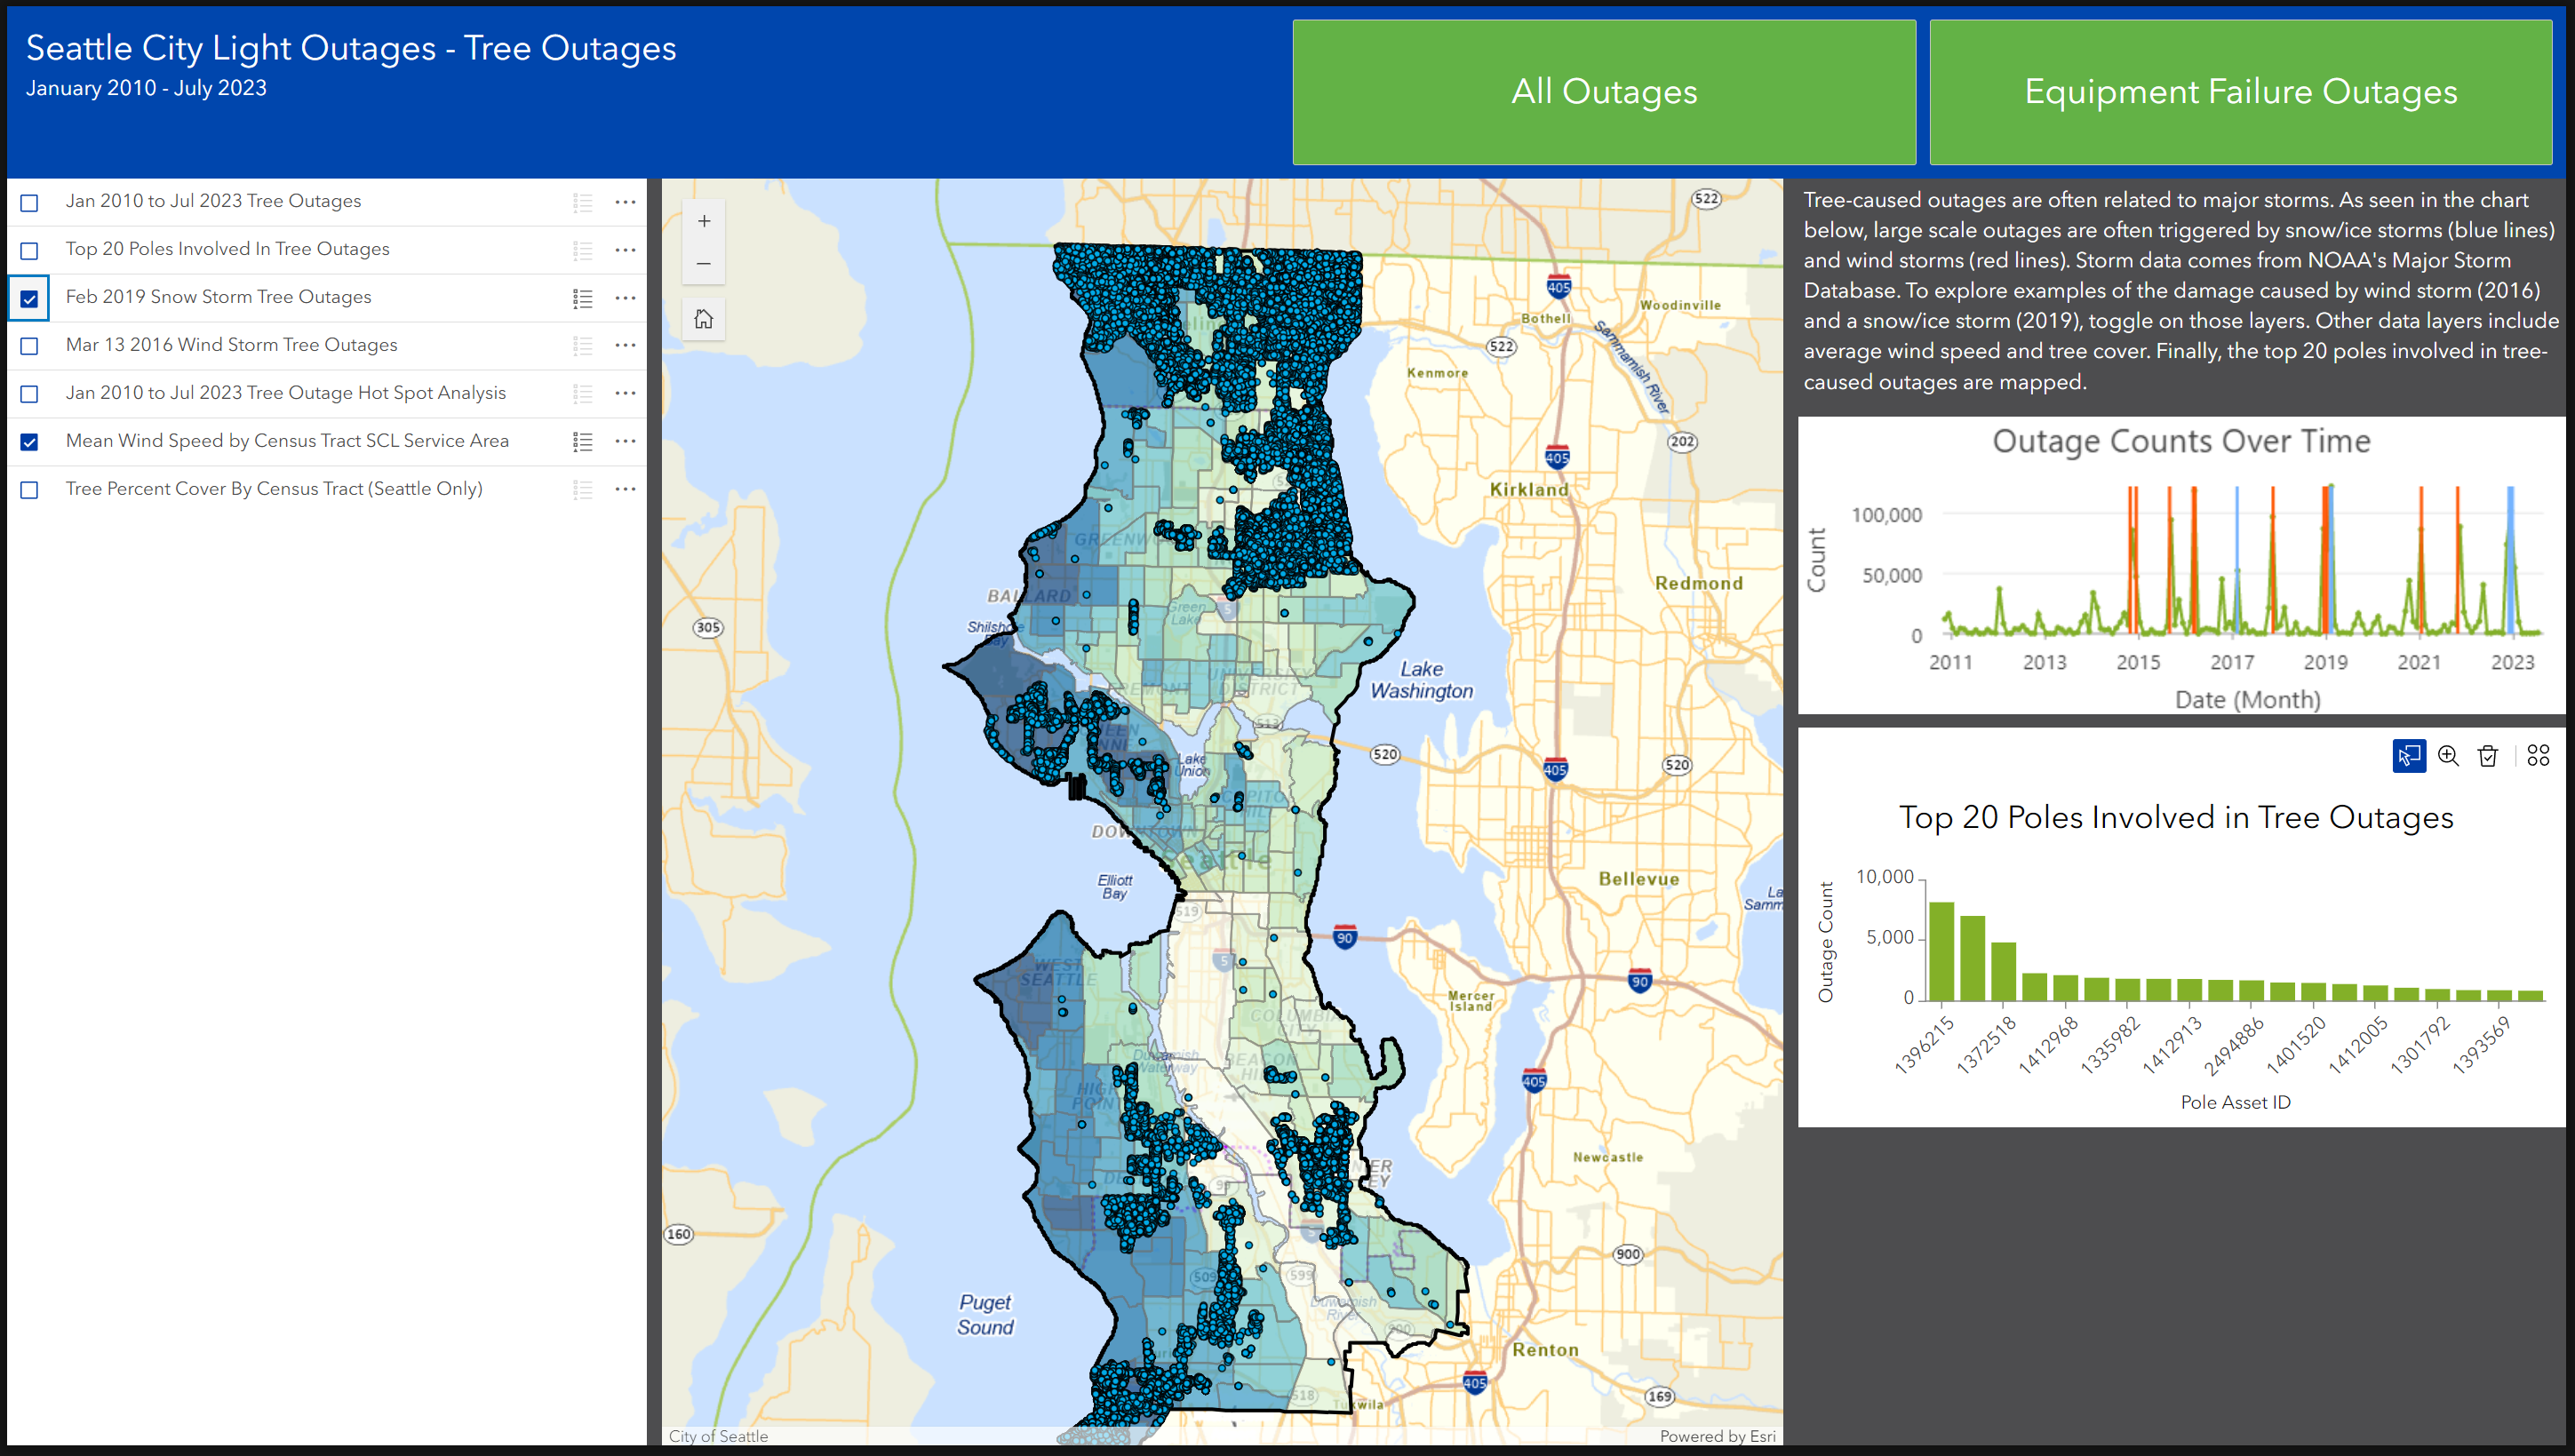
Tree Outage Data Analysis - Windstorm
Experience Builder page screenshot with tree outage data from February 2019 windstorm over a chloropleth map of the mean wind speed across Seattle.
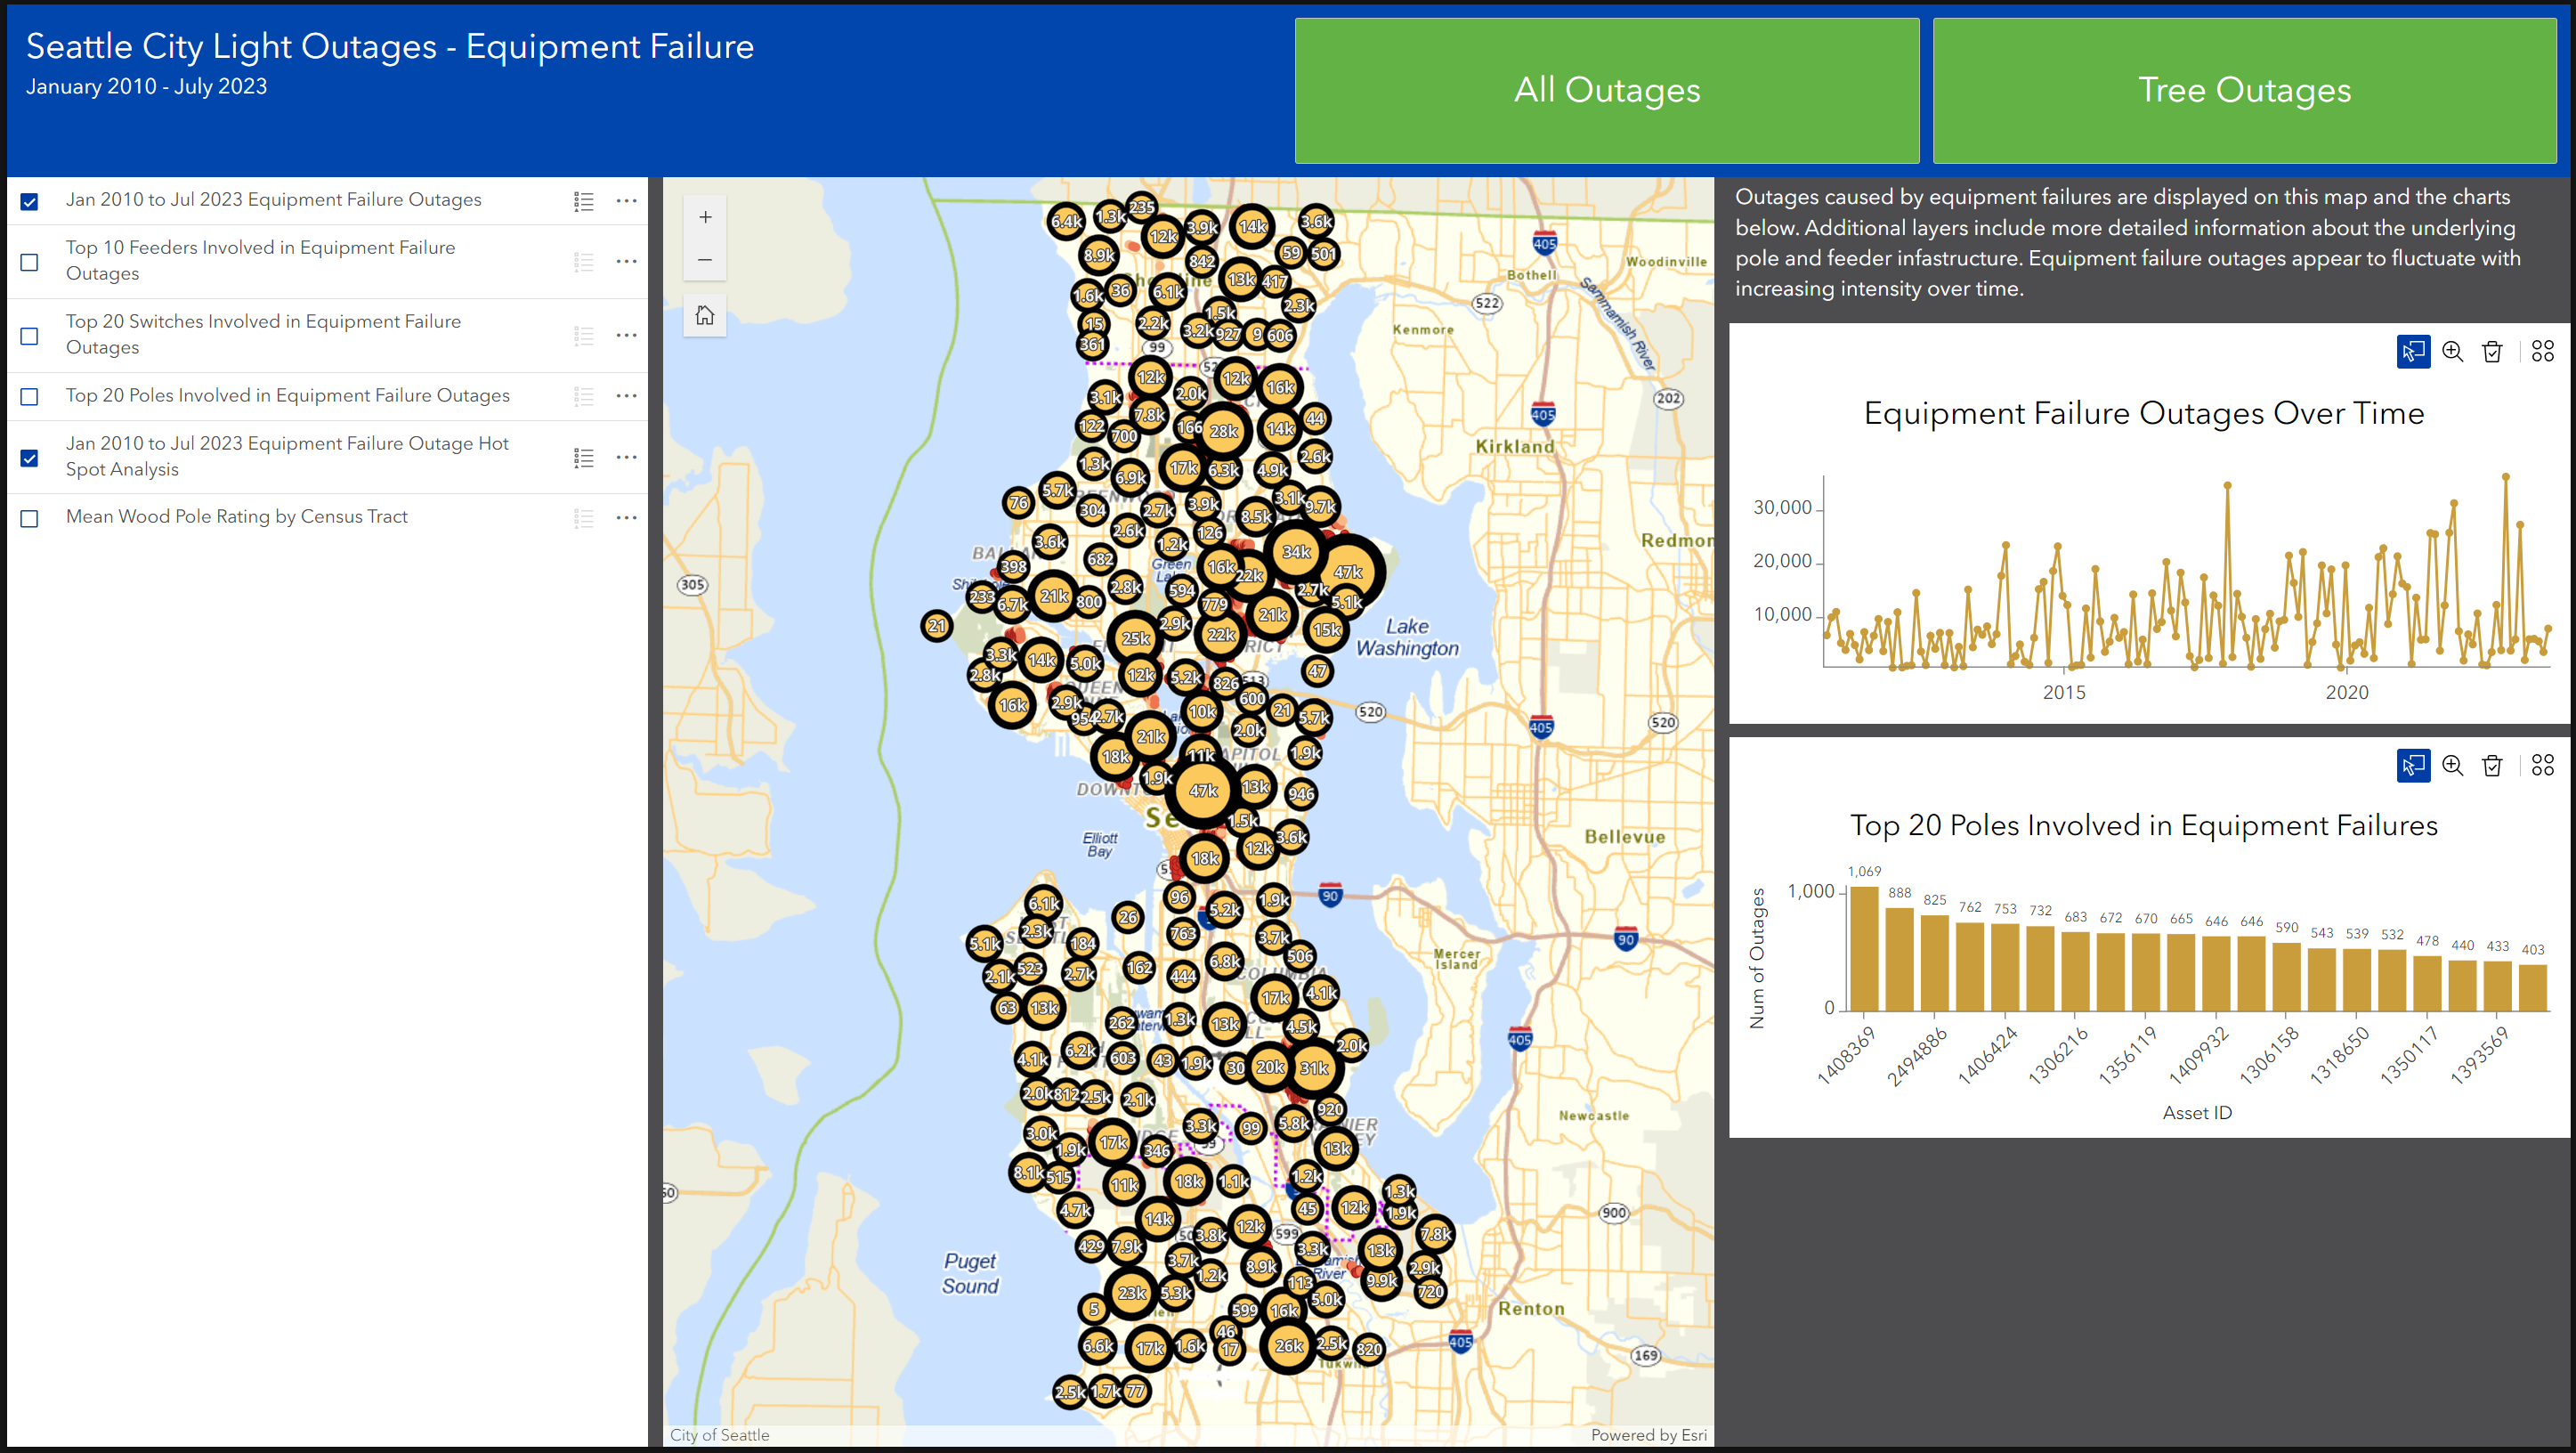
Equipment Failure Outage Data Analysis
Experience Builder page screenshot with equipment failure outage data with aggregation and hot spot analysis. A line graph shows tree outages over time. A bar chart shows the ids of the top 20 poles involved in equipment failure outages.
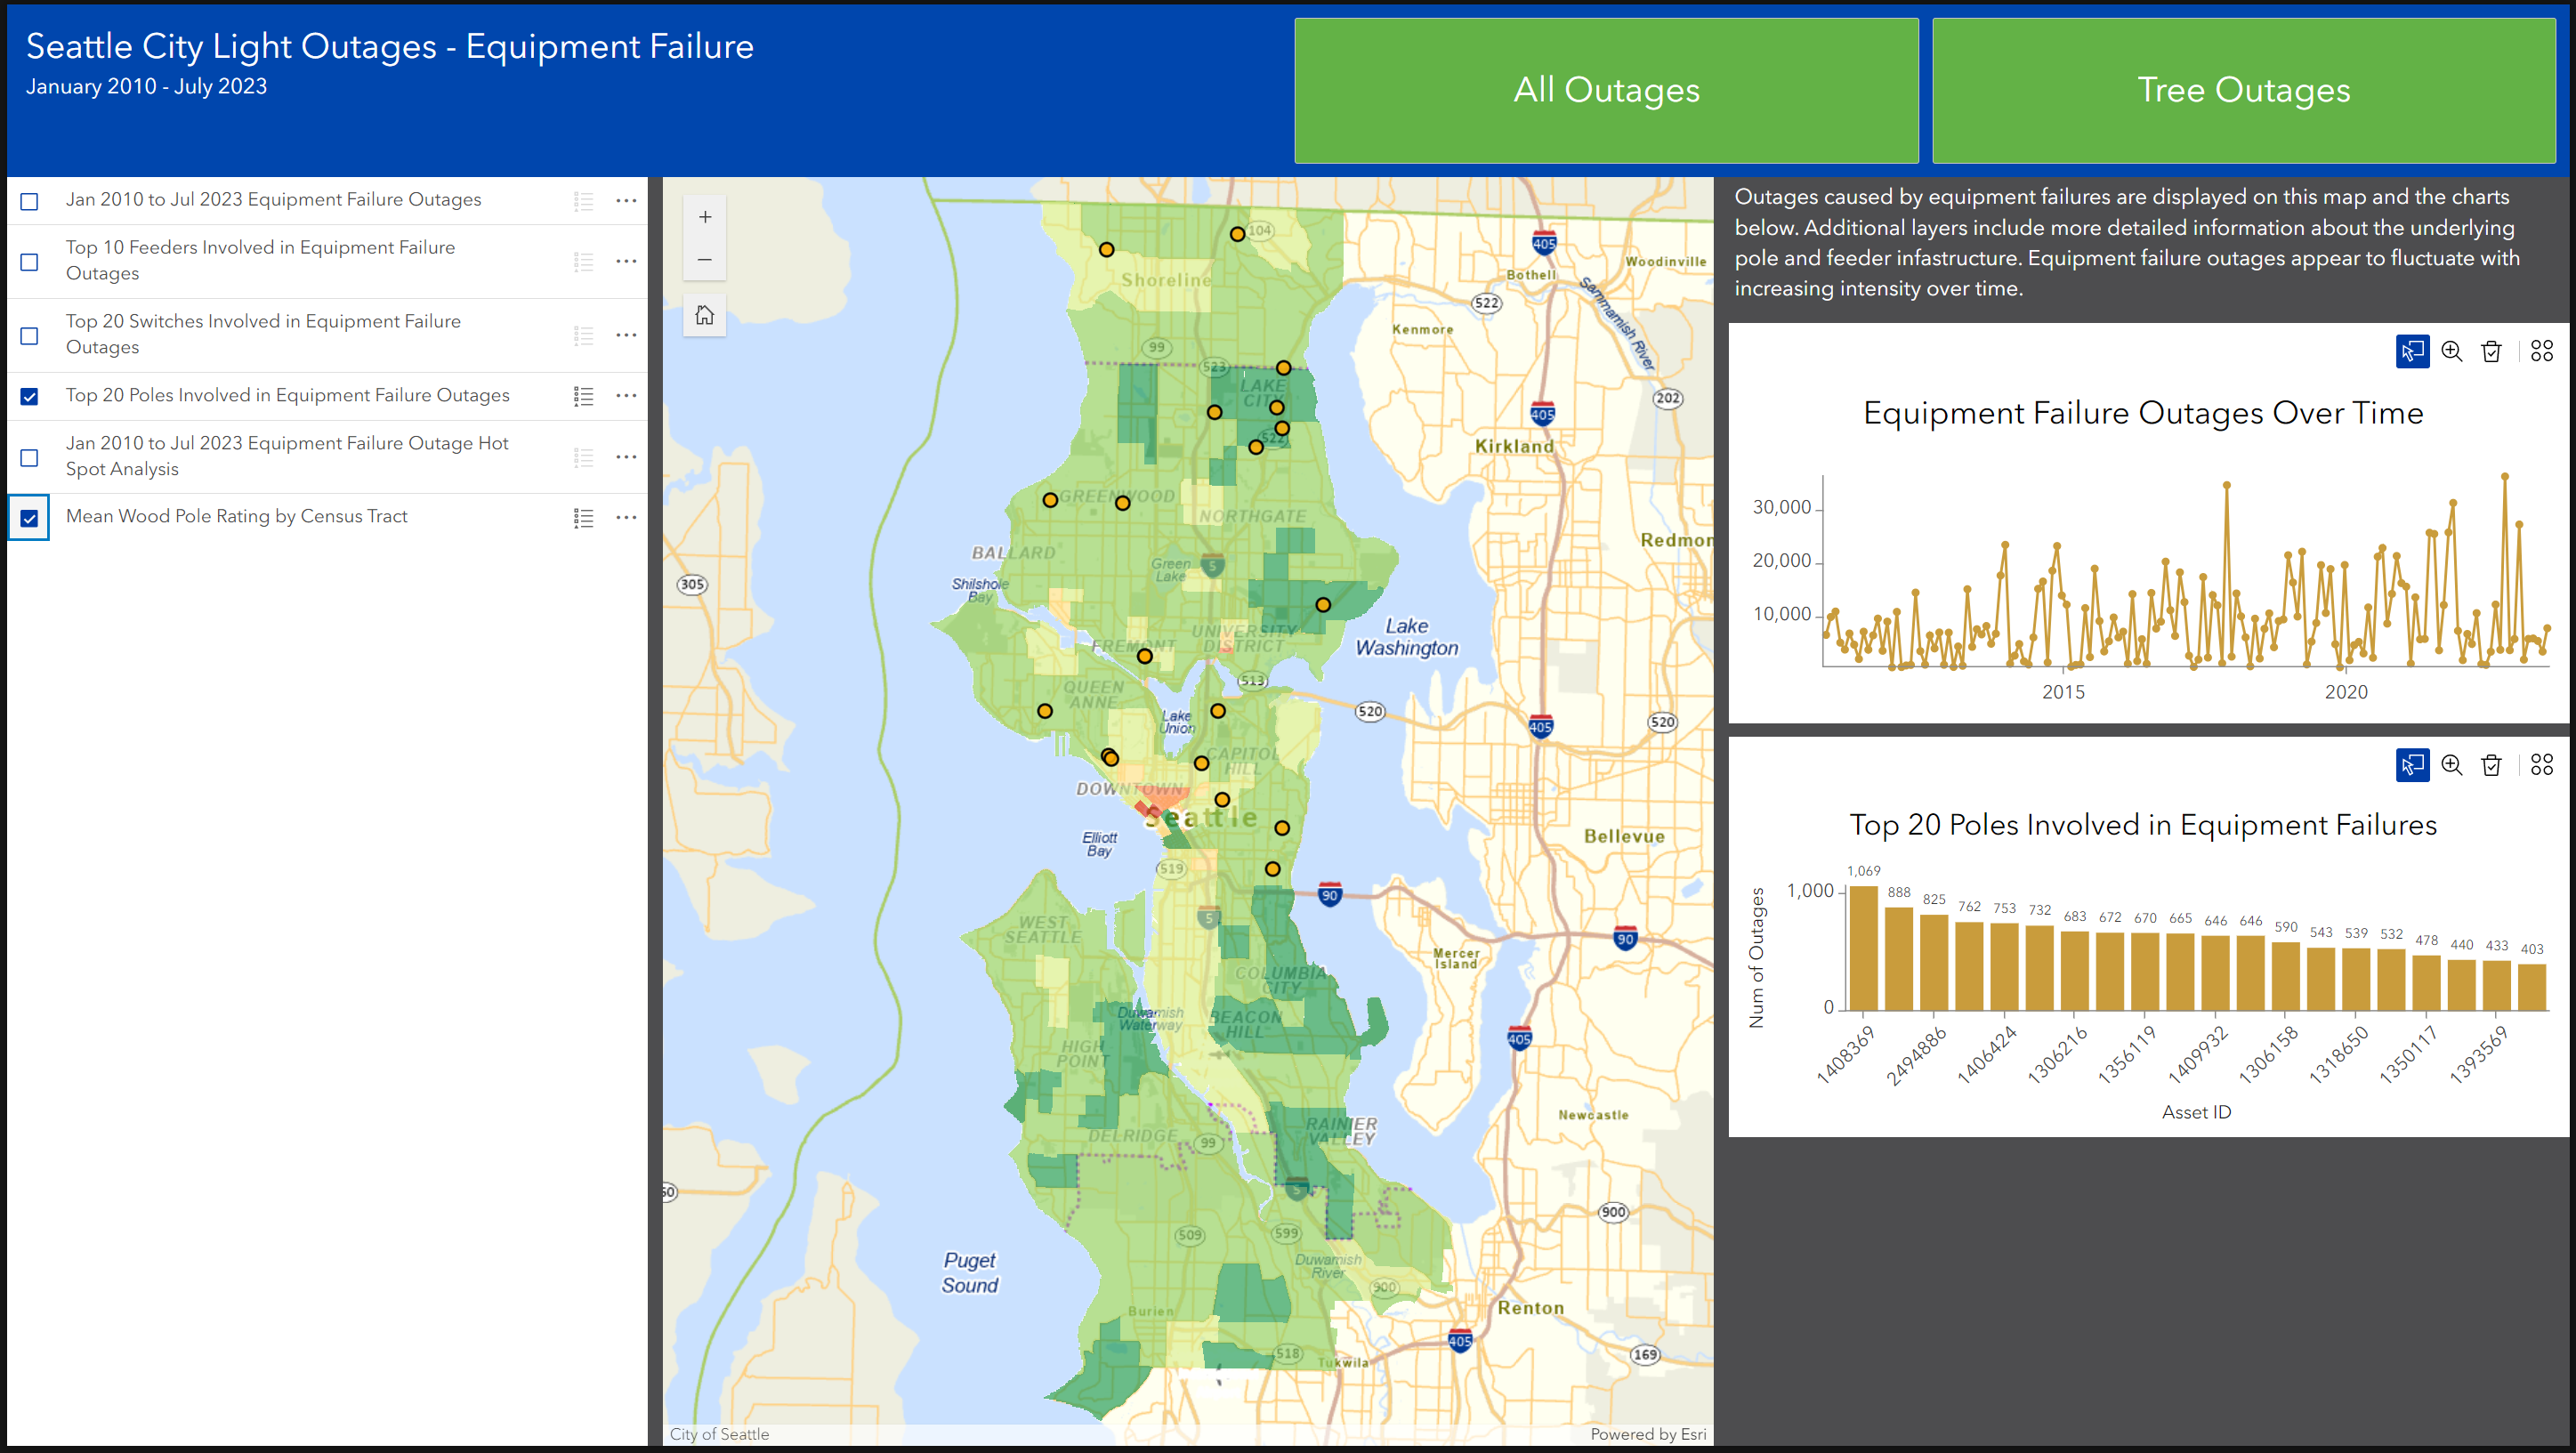
Equipment Failure Outage Data Analysis - Poles
Experience Builder page screenshot showing the location of thetop 20 poles involved in equipment failure outages and a chloropleth map showing mean wood pole ratings by Census Tract.